Back to Home

What do trends in eThekweni’s Ports
Data stories
Ports Overview
Introduction
Economic activity through eThekwini’s ports shows overall positivity with a general and intermittent increase in invoices and throughput in 2018.What do trends in eThekweni’s Ports
tell us about trade in the city?
Port of Durban
The number of containers handled at the Port of Durban increased from 205 620 in November of 2017 to 232 893 in November of 2018, reflecting a 13% growth in year-on-year trade.
The total number of containers landed is slightly above the total number of containers shipped by 6 155 Twenty-Foot Equivalent Units (TEUs).
Durban Port Number of Containers Invoiced
Source:
Transnet National Port Authority, 2018
Dube TradePort
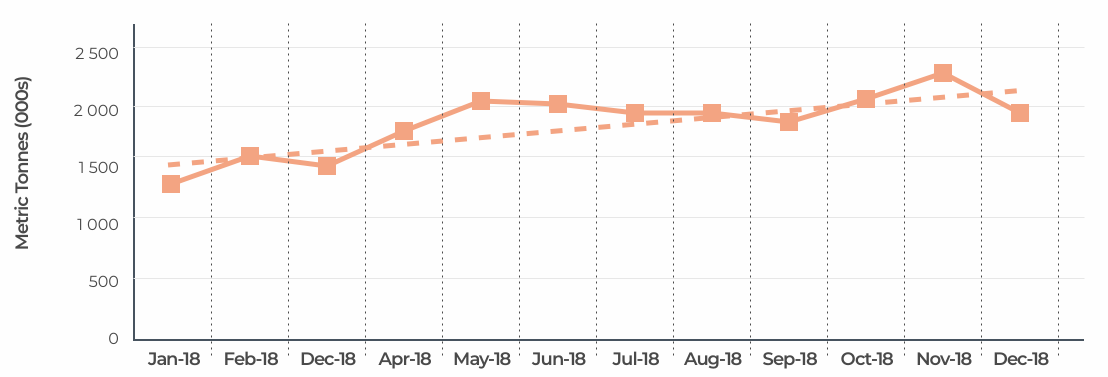
The graph below illustrates that the throughput at Dube TradePort increased by 46% from Jan 2018 to Dec 2018. Cargo terminal freight experienced an annual increase of 19.7% from 18.54 million tonnes in 2017 to 22.19 million tonnes in 2018.
Dube TradePort Cargo Terminal Freight
Source:
Dube TradePort, 2018
Conclusion
At the end of 2018, cargo terminal freight levels at DubeTrade Port were higher than at the start of 2018. The trendline suggests a general upward trend throughout the year. Similarly, the number of containers invoiced at the end of 2018 (237 540) was higher than at the start of 2018 (227 988).
All rights reserved - Terms & Conditions
Make better informed decisions with cutting-edge economic insight
